
Starting on the Road to Big Data
Project Goal and Objective:
As introduced in the first Project Page, this was a self teaching HADOOP project that I created to exapnd my skills. A project was create to learn about the big data tools now being used in the market. The goal was to read the below refrenced maternal and generate big data analytical results.
So the Journey Began:
I first built a single node HDFS/YARN environment using the Noll assistance web pages. Then moved onto a three machine cluster, again with help of Noll pages and the Stack Overflow site. (I still mostly code/program on the single node, it reduces complexity)
Helpful point...There are many flavors of setups with different folder locations and user accounts; pick one and stick to its setup. As you gain information from other configuration and articles as you movew forward and can enhance your platform.
Working Through the book:
Progress started slow, got exposed to excessive detail into HDFS file system on all HADOOP articles. From my view, HDFS is just another file system that is specialized for distributed files with its owns benefits and tools (ntfs and ext4 file system are kind of the same). I suggest to not getting caught in the weeds on this HDFS file distribution/setup, it just works.
On the java code side, during self-teaching for the past 18 months, I grew very tired of the multiple word count examples ( so many copies of the same code). In addition, I never did like that Shakespeare guy and his works even before this journey started. Now, I have no desire at all to pick up his books. Although in the White book, I did find the NOAA examples on temperature more relevant for today's world. In addition, Yahoo has some nice samples of various programs and it should be mentioned that they were the early fathers of Hadoop. (Let's not erase history here...Horton was a late arrival.)
Web Research Points ---> The NOAA example in the White-Safri book got me started on other ideas
- The batch processing on max/min temperate process was a real world measurement (good).
- But, I soon found that multiple folks just created variation of the initial max/min program
- I realized that there was a second key weather element that mother nature has not forgotten, the WIND.
- So, why not study further the WIND, it is not going away?
- In addition, information on steady dependable WIND location are key renewable energy factor.
Problem Statement:
LIVING IN THE US MIDDLE EASTERN STATE REGION, FIND BEST TRI-STATE (NJ, PA, NY) LOCATION WITH DEPENDABLE/ CONSISTENT WIND FOR POSSIBLE HOME WIND TURBINE USAGE.
Solution Steps:
-
Find the best avg/mean wind location in this tri-state location ( NJ,NY, PA)
-
Use these results on home scale or DIY wind generators kits that could benefit with 8-18 knots on mean/average daily wind. Key point is that wind speed measured in knots, and wind cannot be over 18 knots or smaller or home use windmills shutdown to avoid equipment damage. (ie: my -BigW- condition)
Analysis Steps:
-
Look at sources of wind data, were weather recording station locations relevant in Tri-State area (NY, NJ, PA.)
-
Question is if these data sources measure wind data on a daily basis and did they have a validation process? I was looking for daily mean/average, the hourly measurement interval was too detailed for my use/study.
Weather Data Sources:
-
I knew of the NOAA data source that were available, but had trouble with conflicting historical data sets and different file layouts on the NOAA sites. Your can get lost in there large volumes or sea of data on that site. ( hee , hee..NOAA - sea.)
-
Note: It appears that over the years different file layouts and different programs came and went, likely phased out.
-
The private weather source of the' weather underground' was a consideration, but I was unsure of the data consistency and ability to re-publish.
-
Finally, I went back to the NOAA data sources as a low cost idea, but White-Safri book examples did not match up to multiple data sets present in that site. (NOAA ISA vs. GSOD file layouts, big difference and waste two months looking at multiple data options. Big PIA and weeks wasted in data analysis.) Just like a large company or organization with multiple teams/programs with different goals and conflicting data layouts.
Note: Getting lost in their sea of data can and did happen for me on the NOAA site. I recommend that they build a good site map or timeline of past/present program descriptions. It would improve site usability and assist in a better data flow. Also would greatly help it give a clear history of new/old data collection programs.
HADOOP Logic:
Mapper:
- Open or download the text based historical data files, stations in the focused tri-state area
- Pull the relevant data fields out of these text files that fit the data study (ie: Station Numb, Date, Max Wind, Min Wind, Mean Wind)
- Calculate the mean Average per-day in knots in integer form is the key sorting field.
- The logic was also to look for a range of 8-18 knots for the mapper to create output file entry,
Reduce:
- Use the Inter mean wind values to group data
- Output a CSV file with key and the other calcauted files as text
Sample - NOAA Wind data extracted 1980
| Int Mean wind | Station Numb | AFB Numb | Date | Status |
Mean Wind |
Max Wind | % Wind Change |
|---|---|---|---|---|---|---|---|
| 11 | 725140 | 14778 | 19801130 | -Good- | 10.60 | 18.10 | 44.1 |
| 11 | 725140 | 14778 | 19801204 | -Good- | 11.00 | 15.00 | 34.9 |
| 11 | 725140 | 14778 | 19801221 | -Good- | 10.60 | 15.90 | 21.9 |
| 11 | 725144 | 99999 | 19800130 | -Good- | 11.00 | 15.90 | 28.2 |
| 11 | 725144 | 99999 | 19800311 | -Good- | 11.10 | 17.90 | 37.0 |
| 11 | 725144 | 99999 | 19800314 | -BigW- | 11.00 | 23.90 | 36.0 |
| 11 | 725144 | 99999 | 19800414 | -Good- | 10.80 | 14.00 | 48.9 |
| 11 | 725144 | 99999 | 19800428 | -Good- | 10.60 | 15.90 | 53.1 |
| 11 | 725144 | 99999 | 19800514 | -Good- | 11.10 | 15.90 | 71.1 |
| 11 | 725144 | 99999 | 19800609 | -Good- | 10.80 | 14.00 | 71.1 |
| 11 | 725144 | 99999 | 19800926 | -Good- | 11.20 | 17.90 | 69.1 |
| 11 | 725144 | 99999 | 19801025 | -BigW- | 10.70 | 23.00 | 55.9 |
| 11 | 725155 | 99999 | 19800717 | -BigW- | 10.50 | 48.00 | 82.0 |
| 11 | 725155 | 99999 | 19801013 | -Good- | 10.60 | 15.00 | 45.0 |
| 11 | 725155 | 99999 | 19801109 | -Good- | 11.40 | 15.00 | 50.0 |
| 11 | 725156 | 14748 | 19800111 | -Good- | 11.40 | 19.80 | 48.0 |
Note: Cool fact, the 'AFB Numb' data column above is the old 1930's Air Force Base number used, kind of irrelevant now but kept in the data for consistency.
NOAA wind Data Tableau.public - data visual
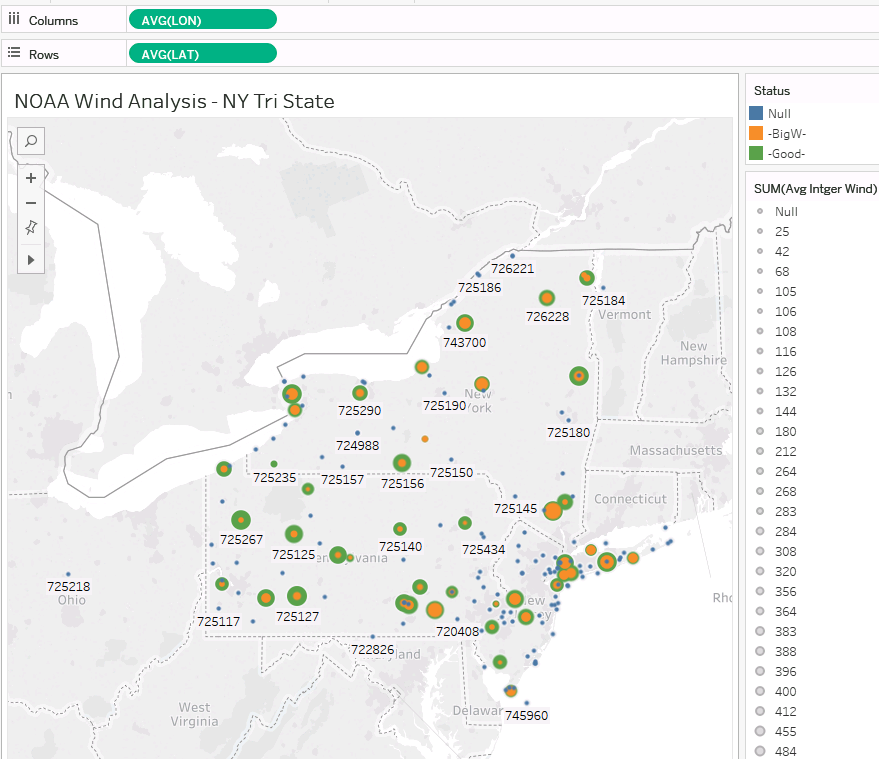
URL of working Tableau.public graphic: : NOAA Wind Tableau Vis Link